Year level: 5 / 6
Strand: Statistics / Measurement
Lesson length: 75 mins
In this lesson, students investigate measurement data related to the osprey. Students represent and interpret data related to wingspan and body length. They investigate patterns in data to describe any relationships.
This lesson is the third in a series of six lessons that connect the cross-curriculum priority of Sustainability, Statistics and the Science learning area: Science as a human endeavour. AC9S5H01, AC9S6H01 and AC9S5H02, AC9S6H02.
This lesson was developed in collaboration with Conservation Without Borders. Data and information provided by Tweed Valley Osprey Project.
Learning goals
Learning intention
- We are learning about ways to represent and report on real scientific data.
- We will use the research tasks to develop our data skills including using a spreadsheet and creating charts.
Success criteria
By the end of this lesson, students can:
- apply place value to measurement problems
- interpret data presented as a table
- use a chart to display acquired data
- visually represent and report on acquired data.
Why are we learning about this?
The work done by research team helps us to learn more about the natural world. Using the context of contributing to a research team gathering data, we can identify patterns, analyse trends, and observe changes over time. Exploring basic technologies, such as GPS tracking used by scientists, enhances our understanding of data collection and analysis. Additionally, mastering the creation and interpretation of data displays is a crucial skill, as it allows us to communicate information effectively through visual means.
Learning hook 5 mins
- Download and use the teacher’s slides to accompany your teaching.
- Use slides 3–4 to view data about the osprey. Ask students to interpret the information and discuss measurements of interest.
- Refer to the two multiple choice questions that relate to measurement of mass. View the notes for support.
- Explain that today we will be looking at data relating to a bird’s wingspan and body length, beginning with the osprey.
Explore 60 mins
Introduction (15mins)
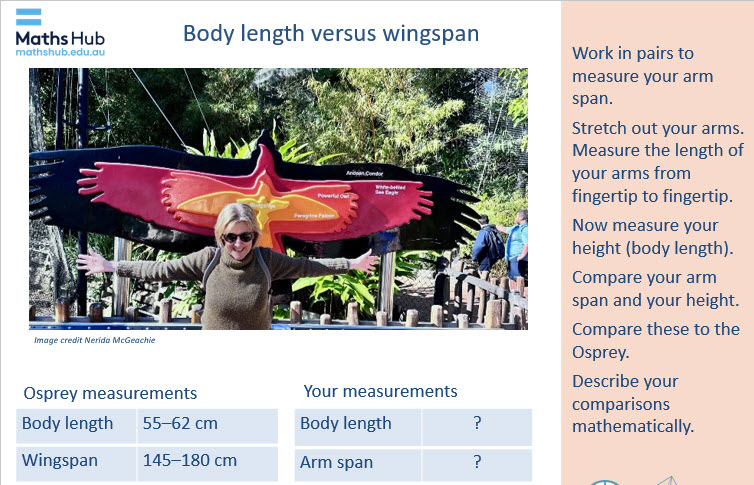
- View data in the table on slide 4 for the osprey’s wingspan and body length, each given as a range. So that students get a sense of the osprey’s large wingspan compared to its body have students measure their arm span and height.
- Organise students to work in pairs to measure each other’s arm span and height (slide 5). Provide measuring equipment.
Slide 5
- Students can record their measurements in their own table or into a shared class table. Alternatively open the spreadsheet Class arm length vs height and project the spreadsheet on a whiteboard. The scatter plot is automatically set up to populate as students’ data is entered. Interpret the scatter plot graph. Explain that a scatter plot is a graph that displays the relationship between two continuous variables, showing individual data points as dots. In our example, the variables are arm span and height.
- Discuss any patterns that students notice. Ask students, ‘How does your arm span compare to your height?’ Generally, the measurements of a person’s arm length and height are a close match.
- Compare these measurements to those of the osprey. Students should be able to estimate that the osprey’s wingspan is about 3 times its body length (based on using the figures rounded to 180 and 60) – much different to humans.
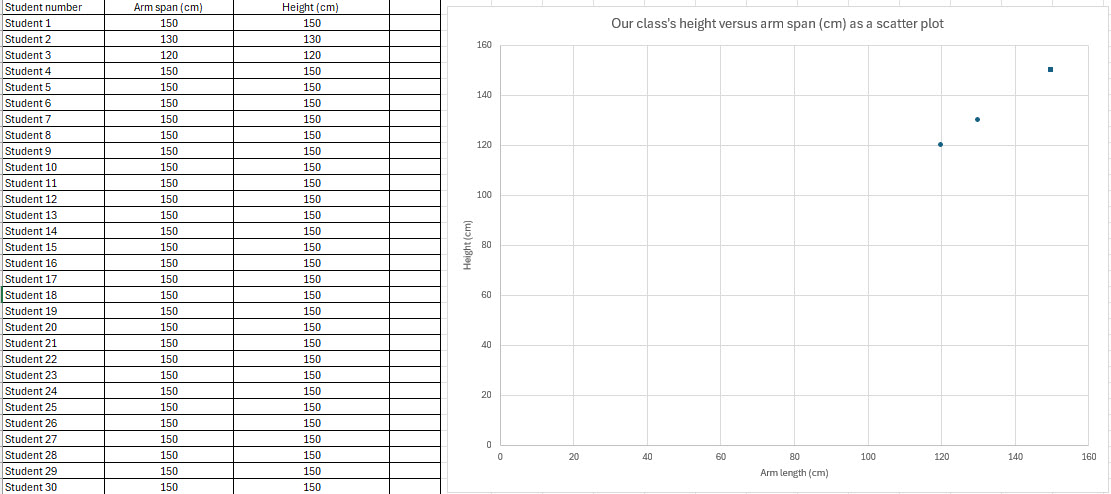
Image: Excel spreadsheet: Class arm length vs height
Practical activity (45 min)
- Provide a table of data from the Body length versus wingspan worksheet for students investigate and represent visually (slide 6). The worksheet has two different partly completed graphs for use by students who require support. Students select a graph type and use data from the table to complete the graph.
Ideally students use a spreadsheet to organise the data and create a graph rather than drawing a graph using pencil and paper.
- For students familiar with using a spreadsheet provide the spreadsheet Wingspan and body length data.
- Consider modelling how to create each type of graph. Use the spreadsheet Wingspan and body length data set up. This includes a table already set up for data entry with the graph auto-generating. Two types of charts are provided. Note: even after a class demonstration, some students may need further help with Excel (MS) or Numbers (iOS) to create their graphs.
- Observe how students are approaching the task. Support them with enabling and extending prompts, as required.
Differentiation (enable)
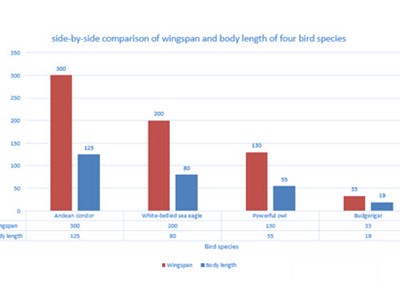
- How can you represent the data? How do you show this data using a side-by-side column graph (slide 7)?
Differentiation (extend)
How might you compare the two variables of wingspan and body length? What type of graph can you use? Can you show body length along the x-axis and wingspan along the y-axis? What patterns do you notice?
Summary and reflection 10 mins
Display slides 8 and 10 and ask students to describe their findings:
- Review similarities and differences in representing data as side-by-side column graph or as a scatter plot.
Use questioning to prompt students to describe the relationship between body length and wingspan.
- For Andean condor, white-bellied sea eagle and powerful owl, which are all raptors, the wingspan is approximately 2.5 times bigger than the body length.
- Students may notice that the four points roughly make a straight line.
Ask students to use their graph to predict a bird’s wingspan.
- If a bird had a body length of 100 cm what might you expect its wingspan to be? Why? (They may suggest 250 cm if it follows the pattern). Use teacher modelling to show that as 2.5 x 100 = 250
- What about a bird with a body length of 40 cm? What would you expect its wingspan to be? (Students may suggest about 100 cm if it follows the same pattern.) Use teacher modelling to show that as 2.5 x 40 = 100