Planning tool
Year levels
Strands
Expected level of development
Australian Curriculum Mathematics V9: AC9M10A04
Numeracy Progression: Number patterns and algebraic thinking: P9
At this level, students apply linear, quadratic and exponential functions (growth and decay) to mathematically model real-world contexts, such as financial contexts, and outline reasons for selecting a particular model. Students use tables of values to look for patterns in data, recognising that linear functions have constant first differences, quadratic functions have constant second differences and exponential functions have a constant ratio between consecutive values of the dependent variable.
Students are presented with a range of modelling situations to explore, for example, simple and compound interest, depreciation and population modelling, some of which should include the use of authentic information and data. They may need guidance when deciding which variables or parameters to investigate, especially for large data sets, such as spreadsheets from the Australian Bureau of Statistics.
Investigations will require students to formulate and solve problems within the situation and choose a suitable model to apply. They then analyse and refine the mathematical-modelling approach taken, communicate, report assumptions and limitations, and consider feedback from peers and teacher to make further refinements.
Teaching and learning summary:
- Have students investigate a range of real-world problems to which they can apply a mathematical modelling approach.
- Encourage students to formulate their own problems, identify variables and create a model to develop solutions and make predictions.
- Have students communicate their mathematical-modelling approach, including analysis of results, assumptions, limitations and conclusions clearly and efficiently.
- Encourage refinement of the model by taking into consideration questions that may have arisen during feedback, for example, have the students considered the most suitable model, what other assumptions could have been made and what unforeseen limitations does the model have?
- Work with authentic information, data and situations to enable students to translate real-life contexts into mathematical models, appreciating that these models are often approximations of the actual situation.

Students:
- apply linear, quadratic and exponential functions to modelling contexts and state their reasons for selecting a particular model
- use tables of values to look for patterns in their data, recognising that linear functions have constant first differences, quadratic functions have constant second differences and exponential functions have a constant ratio between consecutive values of the dependent variable
- work with authentic information, data and situations to translate real-life contexts into mathematical models and appreciate that these models are often approximations of the actual situation
- use mathematical-modelling approaches to solve authentic and real-world problems involving variables that show growth or decay, for example, financial contexts
- create a report that outlines the problem and the modelling used, and explains methods, assumptions, limitations and findings
- communicate their model and findings to their peers and teacher, and respond to feedback to refine their model.
Some students may:
- not appreciate that a model is a representation of relationships between variables and is based on a set of assumptions, and that it often provides an approximation.
- not identify suitable independent and dependent variables to model the situation.
- not recognise that a model has limitations, for example, it applies to a given set of values and may not be able to be extrapolated beyond these.
- need further guidance with conceptual understanding of a https://nrich.maths.org/8336problem, procedural understanding and mathematical reasoning.
- not sufficiently recognise the importance to the modelling process of being able to clearly interpret and communicate the application of a model, and refine it based on critical feedback from others.
The Learning from home activities are designed to be used flexibly by teachers, parents and carers, as well as the students themselves. They can be used in a number of ways including to consolidate and extend learning done at school or for home schooling.
Learning intention
- We are learning to apply knowledge of the properties of linear, quadratic and exponential functions and the differences between them, when selecting a function to model given data.
- We are learning to model depreciation using an exponential decay model.
Why are we learning about this?
Modelling real-life contexts using mathematical functions allows us to better understand a situation, make informed decisions, explore alternative scenarios and consider future possibilities.
What to do
Deciding which model to use
Imagine you had some data you wanted to model. How would you know whether to use a linear, quadratic or exponential function for this model? Understanding the characteristics and features of each of these functions is important to help you decide.
- Write down your understanding of the properties and features of each of the three functions: linear, quadratic and exponential.
- Graph each of the following three functions using a graphics calculator or an online graphing program such as GeoGebra.
linear: y = 2x quadratic: y = x2 exponential: y = 2x - Reread your response to step 1 and refine as needed.
- Four data sets of points are given below: A, B, C and D. Decide which type of function you would use to model each one: linear, quadratic or exponential. Explain your choice.

Modelling depreciation
- A new printing machine is bought for $8000. Its value depreciates (decreases) by 15% every year.
- How much is the printing machine worth at the end of the first year? (Hint: it’s much more than $1200.)
- By the end of the second year, the printing machine will lose 15% of its ‘end of 1st year’ value. How much is it worth at the end of the 2nd year?
- By the end of the third year, the printing machine will lose 15% of its ‘end of 2nd year’ value. How much is it worth at the end of the 3rd year?
- Which one of the following rules models the depreciation of the printing machine, where V represents its value in dollars and y represents years after purchase.
- V = 0.15y
- V = 0.85y
- V = 8000(0.85)y
- V = 8000(0.15)y
- To check your answer, graph the rule you believe is correct in using graphing software, and check if it corresponds to your answers from steps 1 to 3.
- Use graphing software to graph the correct exponential model from step 4 and the linear function
y = –0.85x + 8000. Comment on the differences between linear and exponential models for depreciation.
Additional information and practice
Nrich: Investigating epidemics
Success criteria
- I can apply knowledge of the properties of linear, quadratic and exponential functions and the differences between them, to select a suitable function to model given data.
- I can model depreciation using exponential decay.
Please note: This site contains links to websites not controlled by the Australian Government or ESA. More information here.
Teaching strategies
A collection of evidence-based teaching strategies applicable to this topic. Note we have not included an exhaustive list and acknowledge that some strategies such as differentiation apply to all topics. The selected teaching strategies are suggested as particularly relevant, however you may decide to include other strategies as well.
-

Questioning
A culture of questioning should be encouraged and students should be comfortable to ask for clarification when they do not understand.
Go to resource -

Mathematics investigation
By giving students meaningful problems to solve they are engaged and can apply their learning, thereby deepening their understanding.
Go to resource -

Collaborative learning
For group work to be effective students need to be taught explicitly how to work together in different settings, such as pairs or larger groups, and they need to practise these skills.
Go to resource -

Differentiation
Differentiation involves teachers creating lessons that are accessible and challenging for all students.
Go to resource
Teaching resources
A range of resources to support you to build your student's understanding of these concepts, their skills and procedures. The resources incorporate a variety of teaching strategies.
-

Capital Airways: Part 1
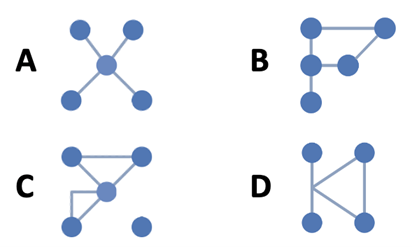
In this lesson students are introduced to the concept of a network through an airline route map.
Go to resource -

Capital Airways: Part 2
In this lesson students use mathematical modelling to re-design the network map of the airline route to improve the airline’s profitability.
Go to resource -

Predicting populations
An inquiry-based lesson encompassing activities that have been developed from real-world data, where students take a mathematical modelling approach. Teacher guidance, student lesson and practice are provided.
Go to resource -

Mathematical modelling
Use this guide to learn more about mathematical modelling and how it can be used in the classroom. Go to 'Köchel numbers’ (p. 16) for a specific example in relation to linear functions to find the answer to a hypothetical question regarding Mozart and his opus.
Go to resource -

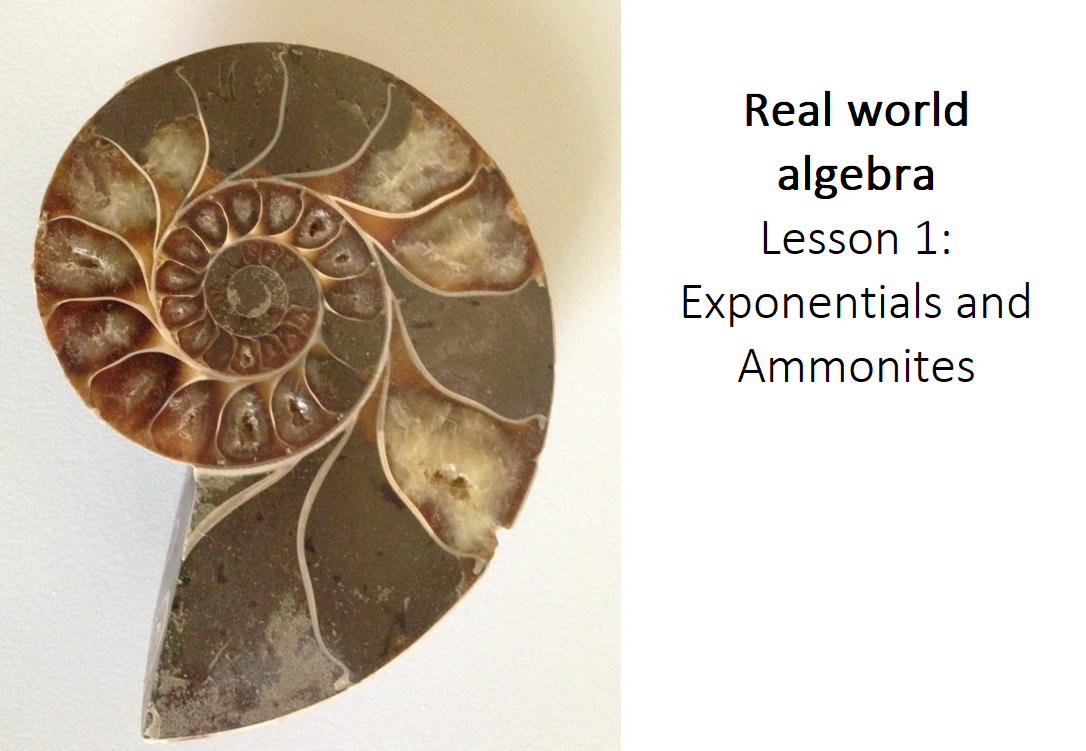
Real-world algebra: exponential functions
Students use dynamic geometry software to investigate exponential functions that model fossil data and trends in energy use.
Go to resource -

Real-world algebra: quadratic functions
Students investigate quadratic functions in three lessons using dynamic graphing software.
Go to resource -

Understanding compound interest
Students learn how compound interest works and why saving now can help you later.
Go to resource -

Different ways to pay
Students learn about the pros and cons of various payment options, what happens to their money, different consumer products and where to go for more information.
Go to resource
Assessment
By the end of Year 10, students can use mathematical modelling to solve problems involving growth and decay in financial and other applied situations, applying linear, quadratic and exponential functions as appropriate, and can solve related equations numerically and graphically.
-

Mathematical modelling
Use this guide to learn more about mathematical modelling and how it can be used in the classroom. Go to 'Köchel numbers’ (p. 16) for a specific example in relation to linear functions to find the answer to a hypothetical question regarding Mozart and his opus.
Go to resource -

Real-world algebra: exponential functions
Students use dynamic geometry software to investigate exponential functions that model fossil data and trends in energy use. The investigation is designed to make meaningful connections between algebraic and graphical forms of exponential growth and decay data.
Go to resource -

Cricket ratings
This problem uses cricket data to analyse questions regarding the scoring rates of two players. Students are guided through the activity and are shown how mathematical modelling can help answer our questions.
Go to resource -

Disease dynamics: understanding the spread of diseases
This collection of investigations allows for differentiation and is based around the topic of disease spread within populations. Choose the activity you wish students to investigate and apply a mathematical modelling approach to.
Go to resource