Planning tool
Expected level of development
Australian Curriculum Mathematics V9: AC9M9A06
Numeracy Progression: n/a
At this level, students bring together knowledge and skills of algebraic and graphical representations of linear functions and quadratic functions. They make these connections by systematically varying the parameters in the rules y = ax + b and y = a(x + h)2 + k, and exploring the effects of corresponding transformations on the graphs of the basic linear function y = x (reflection in the horizontal axis, vertical dilation, vertical translation) and the basic quadratic function y = x2 (reflection in the horizontal axis, vertical dilation, vertical and horizontal translation), respectively.
Students will have some previous experience with drawing graphs of simple linear, quadratic and other functions using tables of values, plotting corresponding points and connecting them by hand. Using digital and interactive tools provides the opportunity for the graphical behaviour of a broader range of examples of these functions to be investigated, and observed patterns to be generalised.
Digital tools also provide students with the means to investigate the graphs of other functions, such as reciprocal, square root, cube and exponential functions. Visually recognising the effects of varying parameters using digital tools for aid, students can apply transformations to identify patterns in their representation.
Teaching and learning summary:
- Use digital tools so that students can manipulate rules of functions to make connections between their graphical and algebraic representations.
- Have students investigate and experiment with varying parameters to identify changes to the graph of the basic function.
- Guide students to transform the graphs of linear and quadratic functions in the coordinate plane, and interpret and generalise their observations
- Have students explore some other simple familiar functions and observe commonalities in the application of these transformations to their graphs.
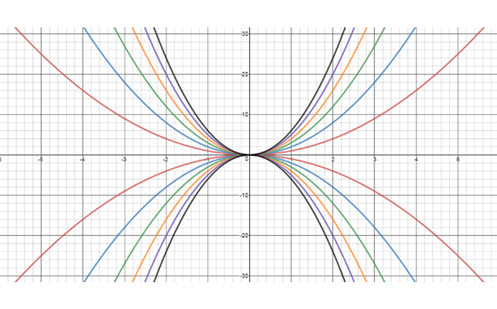
Students:
- vary parameters in rules of functions
- use digital tools to develop and manipulate a broad range of examples
- apply transformations in the coordinate plane to graphs of linear and quadratic functions
- identify patterns resulting from systematic use of transformations on the graphs of other functions, such as reciprocal, square and square root representations, when parameters are varied in their rules.
Some students may:
- have difficulty connecting geometric transformations of shapes on a plane surface to transformations of graphs of functions in the coordinate plane.
- have difficulty understanding that the sign of the term in (x + h)2 is opposite to the direction of horizontal translation,
for example (x + 3)2 corresponds to a horizontal shift of 3 units to the left.
The Learning from home activities are designed to be used flexibly by teachers, parents and carers, as well as the students themselves. They can be used in a number of ways including to consolidate and extend learning done at school or for home schooling.
Learning intention
- I am learning to connect rules of quadratic functions with the shape of the corresponding graphs.
- I am learning to identify patterns resulting from systematically varying the parameters of the quadratic function y = a(x + h)2 + k.
Why are we learning about this?
The graphs of quadratic functions, which are called parabolas, can be described in terms of patterns based on shifts, stretches and reflections of the graph of the basic parabola y = x2. This makes it easier to understand the connection between the rules of quadratic functions in vertex form, such as y = 2(x – 3)2 + 4, and the shape of their graph.
What to do
Use the GeoGebra Parabolas: graphing vertex form to draw graphs of quadratics and observe patterns resulting from changing numbers in the rule.
Shifting the parabola around
- To start, open the graphing software and type y = a(x + h)2 + k. Note the sliders for each of the variables a, h and k.
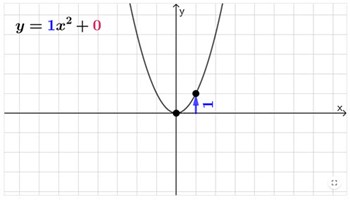
- Keep a = 1 and use the sliders to make h = 0 and k = 0. The graph of the basic parabola y = x2 will be shown, with its vertex at the point (0, 0).
- Keep a = 1 and h = 0 and change the value of k in steps of 1 from 0 to –5. Describe what happens to the graphs shown in terms of the value of k.
- Now have a = 1 and k = 0 and change the value of h in steps of 1 from 0 to –5. Describe what happens to the graphs shown in terms of the value of h.
- Find the values of h and k, with a = 1, for which the vertex of the parabola is at the following points: (2, 3), and (–4, 5).
Stretching and flipping the parabola
- Make h = 0 and k = 0 and change the value of a in steps of 0.5 from 0.5 to 4. Describe what happens to the graphs shown in terms of the value of a.
- Keep h = 0 and k = 0 and change the value of a in steps of 0.5 from –0.5 to –4. Describe what happens to the graphs shown in terms of the value of a.
Using rules to draw graphs and fit points
- Use the sliders to draw the graphs of:
y = 0.5(x + 4)2 – 7 and y = –2(x – 1)2 + 16 - Find the values of a, h and k, for which the graph of the parabola passes through the points with coordinates
(–2, 0), (0, 20) and (2, 0).
Success criteria
- I can connect rules of quadratic functions with the shape of the corresponding graphs.
- I can identify patterns resulting from systematically varying the parameters of the quadratic function y = a(x + h)2 + k.
Please note: This site contains links to websites not controlled by the Australian Government or ESA. More information here.
Teaching strategies
A collection of evidence-based teaching strategies applicable to this topic. Note we have not included an exhaustive list and acknowledge that some strategies such as differentiation apply to all topics. The selected teaching strategies are suggested as particularly relevant, however you may decide to include other strategies as well.
-

Mathematics investigation
By giving students meaningful problems to solve they are engaged and can apply their learning, thereby deepening their understanding.
Go to resource -

Questioning
A culture of questioning should be encouraged and students should be comfortable to ask for clarification when they do not understand.
Go to resource -

Concrete, Representational, Abstract (CRA)
The CRA model is a three-phased approach where students move from concrete or virtual manipulatives, to making visual representations and on to using symbolic notation.
Go to resource -

Differentiation
Differentiation involves teachers creating lessons that are accessible and challenging for all students.
Go to resource
Teaching resources
A range of resources to support you to build your student's understanding of these concepts, their skills and procedures. The resources incorporate a variety of teaching strategies.
-

Function transformations
This digital activity lets students explore four types of function explanations, allowing for systematic manipulation of their parameters.
Go to resource -
Quadratic functions
Have students explore these various digital interactives to understand the algebraic language and its graphical complement and changes that occur when parameters are varied.
Go to resource -
Linear, quadratic and exponential functions
This valuable site creates pathways to the systematic interpretation of linear and quadratic equations and the connection to their graphical function.
Go to resource -
Parabolic patterns
Rather than beginning with equations and then graphing them, students work backwards to identify corresponding algebraic equations and their complementary graph. A downloadable worksheet is included.
Go to resource -

Vertex form of parabolas and quadratic models
This resource is a detailed teaching sequence with related content that covers the vertex form of quadratic functions and related modelling applications.
Go to resource
Assessment
By the end of Year 9, students can describe the effects of variation of parameters on functions and relations, using digital tools, and make connections between their graphical and algebraic representations.
-

Solving linear systems by graphing
This interactive session helps students to repeatedly move lines on the Cartesian plane to visually identify its corresponding equation.
Go to resource -
Quadratic functions anatomy (3)
This interactive with related questions prompts students to vary the parameters for a particular function to make connections between algebraic equations and their graphical counterparts.
Go to resource -

Negatively triangular
This problem requires students to think laterally to mathematically investigate three of four straight lines that form a triangle. Use digital tools or have students draw the lines on a Cartesian plane to solve the problem.
Go to resource