Building connections by using one activity to develop multiple ideas
Antje and David Leigh-Lancaster, Leigh-Lancaster Consulting
Introduction
Have you ever felt that there is a lot of content to get through?
So many parts of a topic to teach?
One way to deal with this is to look at where aspects of a topic can be combined and addressed using a single activity rather than through a series of discrete activities. This approach also has the benefit of developing conceptual understanding and procedural fluency together.
This article discusses:
- some ways in which conceptual understanding and procedural fluency can be developed together in a single activity
- the benefit of teaching multiple ideas and skills through one activity rather than a series of discrete activities.
Developing conceptual understanding and procedural fluency in the same activity
The following sequence shows how several statistical ideas, skills and processes can be efficiently developed together in a single statistics activity.
Activity
Create different sets of 10 values using the digits {0, 1, 2, 3, 4, 5, 6, 7, 8, 9}, where you can repeat or leave out digits, to meet each of these conditions:
- mean < median < mode
- mode < mean < median
- mode < median < mean
- median < mean < mode
- mean = median = mode
For each dataset:
- calculate the mean, median and mode
- graph the values on a dot plot
- describe the shape of the distribution and comment on how this relates to the order of the central measures.
For example:
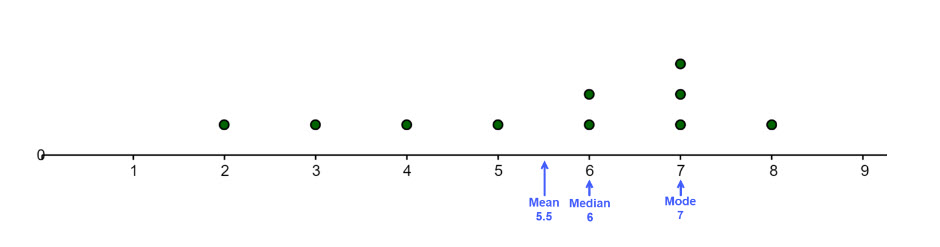
Consider this dataset of 10 values {2, 3, 4, 5, 6, 6, 7, 7, 7, 8}; it has mode 7, median 6 and mean 5.5. So, this dataset meets condition A: mean < median < mode.
Benefits of this approach
By working with all three measures of centre together, students can:
- develop a clearer understand of what each one represents
- develop a sense of how robust or sensitive they are to changes in values
- see how their order is reflected in the shape of the distribution of the data.
Procedural fluency is developed through the repeated process of selecting values and determining each central measure.
By combining several aspects of the topic, the overall conceptual understandings of the shape of a distribution and its corresponding central measures are strengthened, with the connection between these ideas made more explicit for students.
Some other contexts in which this approach could be used:
- Ratio and proportion: This area of mathematics can be challenging for students, involving recognition of part-part and part-whole ratios, formulating proportion problems with the correct correspondence of terms in a ratio, and calculating proportions using the unitary or other methods. Seeing how the different aspects of ratios and proportion fit together within one real-world problem can help students more readily connect these ideas and build their understanding. In contrast, covering the same content through a series of smaller, discrete problems can make it harder for students to piece them together.
For example, a concrete path, 10 m long, 1.5 m wide and 0.15 m deep is to be constructed for a house. The mix for the concrete is water:cement:sand:gravel in a 1:2:4:6 ratio. With costs provided for the materials, students can be asked to specify the amounts of materials required and the total cost of the path, thereby covering each of the mathematical aspects indicated above.
- Linear functions and models: This area of mathematics has several aspects students need to piece together: simplifying and expanding algebraic expressions, solving equations, substitution into rules and constructing tables of values, drawing graphs, finding and interpreting gradient and intercepts, and solving worded problems. Addressing these using one activity to solve a practical problem in a modelling context enables students to more readily connect them, as well as provides both context and purpose for the learning.
For example, linear models are used to describe maximum heart rate as a function of age and to calculate heart rate ranges relating to exercise. This context can be used to either introduce or draw together some of the different aspects of linear functions and algebra.
Simple linear model: maximum heart rate = 220 – (1 x age)
More detailed model: maximum heart rate = 206.9 – (0.67 x age)
Graphs and tables of values can be used to represent, analyse and compare these two models, for example, when each model predicts the same maximum heart rate, and what the differences are between the two models over an age range of 0 to 100. In the process, students substitute into rules and solve equations graphically and algebraically.
Some questions to consider when planning for this kind of approach and activity
- What mathematical concepts and understanding do I want students to develop during this activity?
- What natural connections are there between these concepts and related knowledge and skills?
- How will the activity be structured to effectively facilitate making these connections?
- What formative and summative assessment questions and tasks will I use to check these understandings and connections are being made?
- How will I draw together, summarise and consolidate the important learnings from the activity?
Some useful related references:
AMSI: What are ‘rich tasks’ in maths, and why are they important? – Calculate
This article discusses how rich tasks can be used together to develop mathematical reasoning, conceptual understanding and procedural fluency.
GeoGebra: Dot Plot Maker – GeoGebra
This resource constructs dot plots for datasets of up to 30 numerical values and provides mean and median values.
Mathematics Hub: Conduct statistical investigations : Year 7: Planning tool
This resource provides a framework for conducting statistical investigations, including consideration of central measure and shape of a distribution.