Year level: 5
Strand: Statistics
Lesson length: 75 mins
In this lesson, students acquire data related to the altitudes reached by fledgling osprey practising flight. Students represent and interpret the data, discussing and reporting on the data distribution including the range and mode.
This lesson is the first in a series of six lessons that connect the cross-curriculum priority of Sustainability, Statistics and the Science learning area: Science as a human endeavour. AC9S5H01, AC9S6H01 and AC9S5H02, AC9S6H02.
This lesson was developed in collaboration with Conservation Without Borders. Data and information provided by Tweed Valley Osprey Project.
Learning goals
Learning intention
- We are learning about ways to represent and report on real scientific data.
- We will use the research tasks to develop our data skills, including using a spreadsheet and creating charts.
Success criteria
By the end of this lesson, students can:
- identify the range of the data (lowest value to highest)
- identify the mode (the value in the data that occurs most frequently)
- visually represent and report on acquired data.
Why are we learning about this?
The work done by research teams helps us to learn more about the natural world. Using the context of contributing to a research team gathering data, we can identify patterns, analyse trends and observe changes over time. Exploring basic technologies, such as GPS tracking used by scientists, enhances our understanding of data collection and analysis. Additionally, mastering the creation and interpretation of data displays is a crucial skill, as it allows us to communicate information effectively through visual means.
Learning hook 10 mins
- Capture students’ curiosity and interest in the plight of the osprey using the video (slide 2). The ‘Flight of the osprey’ project gathers vital data on threats to this iconic bird and other migratory species. Invite students to ‘join’ the project team as a junior researcher.
- Provide students with some background information about the osprey (slide 5). You may want to incorporate science learning and later conduct a KWL chart for students to find out more about the osprey.
- Make it known you will be using real-world science data to learn more about this iconic bird species.
Explore 20 mins
Introduction (20 mins)
- Explain that scientists look for patterns in data and often look for changes over time.
Slide 6
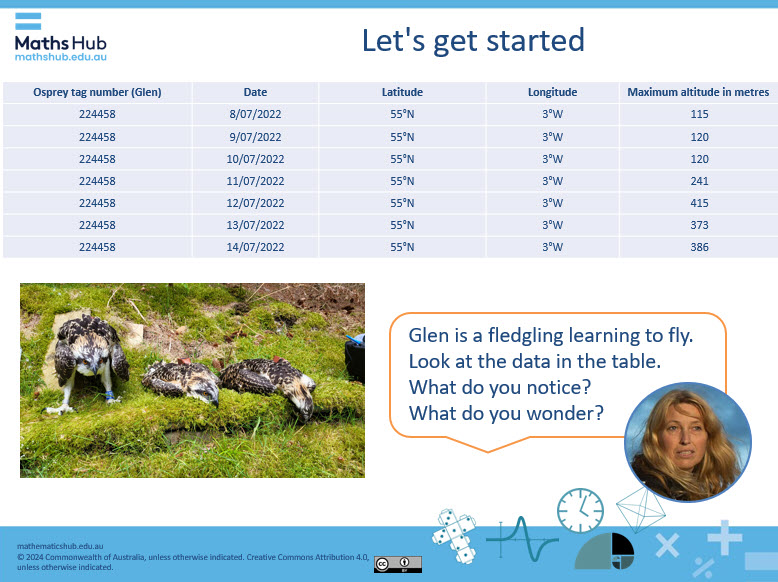
- Provide a table of scientific data captured about the osprey for students to view (slide 6). Ask them what they notice and wonder. Some points to unpack about might include:
- Date: The data was collected over one week and is in date order.
- ID: The data is collected on one osprey. ID relates to identification number.
- Latitude and longitude: This provides the location data. It uses two points that intersect, similar to what students might have experienced with x and y values on a Cartesian plane.
- Altitude: This data is related to the maximum height in metres the bird has reached on that day.
Students might wonder:
- how the scientists captured the data
- what are latitude and longitude
- what the data means.
Discuss data-related questions or park them and answer them as students progress through the lessons.
- Use slide 7 to discuss altitude using relative height including three comparisons: a two-storey house, a very tall tree and a tall building.
- Ask students to choose an altitude value displayed in the table (slide 7). Ask them to use at least one of the three objects to describe the relative height of the altitude. Use teacher modelling to work through an example.
- 373 m is about 37 times as high as a two-storey house
- 373 m is about 5 times as high as a very tall tree
- 373 m is nearly twice as high as a skyscraper such as International Towers in Sydney
- Give students time to complete the task and record their comparison. Share some of the students’ comparisons.
- Summarise by explaining that using a familiar object to describe altitude is a concrete way to better understand the scale.
Explicit teaching (10 mins)
- Use teacher modelling to show some strategies to work out the mode of a dataset.
- In this simple dataset {5, 3, 7, 5, 5, 9, 1}, the mode is 5 as that is the value that appears most. The mode can be counted and represented on a number line.
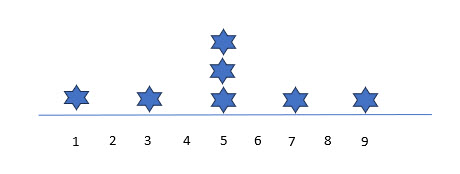
Image: number line to represent the mode of a dataset
- Demonstrate that in larger datasets it is useful to order the dataset smallest to largest.
{3, 6, 18, 11, 18, 14, 5, 34, 23, 24, 3, 18, 35, 31, 34, 23, 45, 18, 21, 34, 40}
That dataset ordered from smallest to largest is {3, 3, 5, 6, 11, 14, 18, 18, 18,18, 21, 23, 23, 24, 31, 34, 34, 35, 40, 45}. In this example, the mode is 18.
- Explain that in very large datasets a spreadsheet can be used to order values using the ‘sort’ function. You may decide to demonstrate this wilth some data.
- Check that students have a good understanding of mode. This may need explicit teaching to ensure all students are proficient at working out the mode.
Practical activity (30 mins)
- Provide the Fledgling osprey altitude data sheet, which includes a table of data recorded over two months of a fledgling osprey’s maximum altitude reached each day. Explain the task using slide 8. For students familiar with Excel, provide the data in the Excel spreadsheet, Fledgling osprey altitude data.
- Ask students to work out the data range (lowest to highest).
- Identify the mode (the value that occurs the most frequently).
- Describe some key points about the data in relation to what it shows.
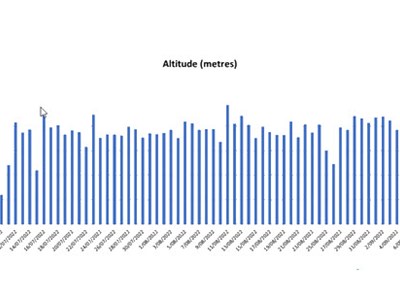
- Students familiar with creating a chart in Excel may produce a chart similar to this:
- Use the chart to draw conclusions about the altitudes reached including identifying the mode, perhaps with a different coloured column to the rest of the chart.
- Note in the altitude data provided the range is 115 m to 489 m with a mode of 385 m, which appears four times.
Differentiation (support)
- How can you organise the data to find the mode?
Differentiation (extend)
- How can you represent that data to make it easier to interpret?
Summary and reflection 5 mins
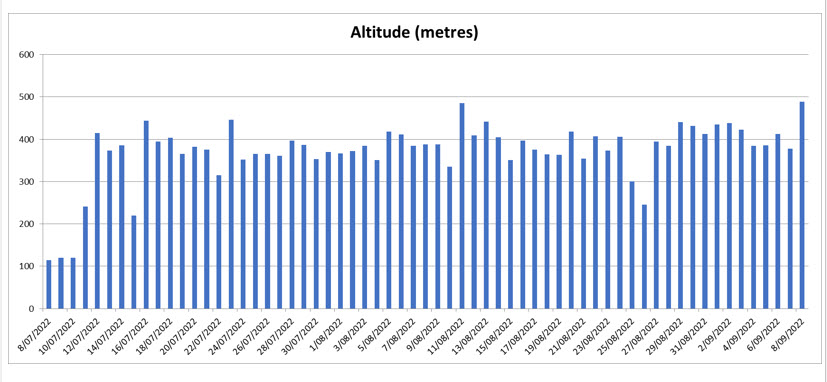
Display slide 10 and ask students to describe their findings.
- Discuss the graph’s title and what a better title might be, for example, Fledgling osprey maximum altitude for journey Jul–Sep 2022.
- Discuss what the labels should be for the x and y axis, for example, x axis time in days and y axis altitude (height in metres).
- Remind students that a column graph would be considered a standard way to represent the altitude data.