Is the AI model accurate?
Year level: 6
Strand: Statistics / Number / Probability
Lesson length: 90 mins
In this lesson, students conduct a statistical investigation to gather data to evaluate how well an artificial intelligence (AI) model works. Students apply their knowledge of percentage and use digital tools to record and analyse data.
This lesson has cross learning area connections with Digital Technologies.
Curriculum information
Achievement standard
By the end of Year 6, students solve problems involving finding a fraction, decimal or percentage of a quantity and use estimation to find approximate solutions to problems involving rational numbers and percentages. Students compare distributions of discrete and continuous numerical and ordinal categorical data sets as part of their statistical investigations, using digital tools. They use mathematical modelling to solve financial and other practical problems involving percentages and rational numbers, formulating and solving the problem, and justifying choices. They solve problems involving finding a fraction, decimal or percentage of a quantity and use estimation to find approximate solutions to problems involving rational numbers and percentages. They assign probabilities using common fractions, decimal and percentages.
Content descriptions
Students plan and conduct statistical investigations by posing and refining questions or identifying a problem and collecting relevant data; analyse and interpret the data and communicate findings within the context of the investigation. AC9M6ST03
Students interpret and compare datasets for ordinal and nominal categorical, discrete and continuous numerical variables using comparative displays or visualisations and digital tools; compare distributions in terms of mode, range and shape. AC9M6ST01
Students approximate numerical solutions to problems involving rational numbers and percentages, including financial contexts, using appropriate estimation strategies. AC9M6N08
Students recognise that probabilities lie on numerical scales of 0–1 or 0%–100% and use estimation to assign probabilities that events occur in a given context, using common fractions, percentages and decimals. AC9M6P01
General capabilities
Numeracy:
- Interpreting fractions (Level 7 )
- Proportional thinking (Level 1 )
- Interpreting and representing data (Level 4 )
- Understanding chance (Level 4 )
Critical and creative thinking
- Develop questions (Level 4 )
- Identify, process and evaluate information (Level 4 )
- Draw conclusions and provide reasons( Level 4 )
Digital literacy
- Interpret data (Level 4 )
Assessment
Assess group work samples and collaboration.
- Take note while observing student input into the collaborative group.
- Discuss the completed table of data and visualisations with each group. Discuss the data enabling each student to explain aspects of the statistical investigation.
- How well do students explain the distribution of discrete data? Do they draw accurate conclusions from the data collected? Do they use the data to answer their inquiry question?
Exit ticket
- Ask students to respond to one of these prompts:
- The AI recognised each gesture with the same level of accuracy.
- Sometimes the AI got confused.
- The AI was more successful at one gesture than the others.
- There are many factors that affect the accuracy of the AI model.
Ask a follow-up question, ‘How do you know?’ Encourage students to refer to their data. Use this task to assess a student’s use of data and percentage when making their claims in response to one of the prompts.
Areas of challenge
Some students may:
- have difficulty formulating questions that have a statistical application that result in collecting relevant data
- have difficulty accurately representing data using a relevant data display; they may use a scale that is inappropriate or inaccurate and does not suitably fit the range of data points
- have difficulties representing and interpreting percentages.
Prerequisite student knowledge and language
Prior to this lesson, it is assumed that students have knowledge of:
- percentages, for example, 100%, and relate to measures of certainty
- how to calculate percentage of common fractions, for example, half, quarter, three-quarters
- recording data in a table, preferably using a computer and spreadsheeting software such as Google sheets, MS Excel for Windows devices or Numbers for Apple devices.
What you need:
Lesson plan (Word)
Teacher information sheet (Word)
For each group, a digital device with a webcam/camera, internet connection and access to spreadsheeting software
Pre-made AI models Rock, paper, scissors model 1 and Rock, paper, scissors model 2
Learning goals
Learning intention
- We need to collect data to evaluate how well an AI model works.
- We will conduct statistical investigations that follow this process: planning the approach; collecting data; representing, interpreting and analysing the data; making inferences; and communicating and using the results to take action or make a decision.
- We will draw on our knowledge of percentage and probabilities.
Success criteria
By the end of this lesson, students can:
- design and conduct a statistical investigation to gather relevant data to answer their inquiry question
- interpret and analyse data
- make inferences and communicate the results, using percentage in a meaningful way.
Why are we learning about this?
AI is an emerging technology and it’s important students understand both how AI works and how it can be used.
AI makes predictions based on a confidence level measured as a percentage. To be numerate, students need to apply percentage in their daily lives.
Evaluating is a key skill students need to develop. Evaluating how well a particular outcome is achieved requires data to back up any inferences.
Learning hook 10 mins
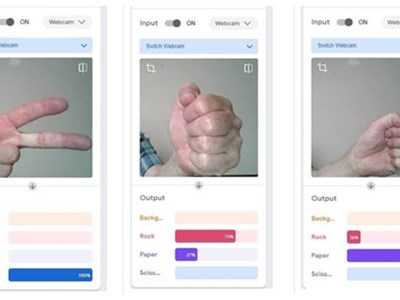
- Display a pre-made AI model, to your class. You can use this example using Teachable Machine: Rock, paper, scissors model 1 .
- Explain that the AI model is trained to recognise hand gestures and classify them as ‘rock’, ‘paper’ or ‘scissors’. Have several students test the model using hand gestures.
- Model how to use the AI and explain safe use of technology. Explain that is good practice not to record your image on web-based applications in order to protect your privacy and limit your digital footprint. To help students avoid capturing their faces via the camera, demonstrate how to turn the input off to pause the webcam until they are ready to test the AI. Turn on the webcam when testing the AI.
- Highlight the use of percentage and explain that the AI makes predictions based on a confidence level shown as a percentage. Connect this percentage to the proportion of the bar highlighted. Discuss the scale and percentage. If the bar is fully coloured 100%, the AI is very sure (certain). If the bar is only partly coloured and a mix of classes, the AI is uncertain.
- Pose the question: How do we know if the AI model is accurate?
- Introduce the learning intentions and success criteria.
- Organise students into collaborative groups to plan and conduct their statistical investigation. Scaffold the process by providing these prompts:
- What is your question to investigate?
- What data will you collect?
- How will you record the collected data?
- How much data will you need, and why?
- What will you do with the data?
- How will the data help you answer your inquiry question?
Explore 75 mins
- Provide each group of students with a digital device that has a camera/webcam and one or both of the pre-made AI models Rock, paper, scissors model 1 and Rock, paper, scissors model 2 . Some groups may decide to compare the two AI models.
- Monitor safe use of the technology. Ensure the set-up is suitable and technology is working.
- Provide guidance using questioning and feedback to ensure each group’s inquiry question is suitable and that the suggested approach to data collection is well constructed. Provide feedback that clearly describes the strengths of the approach and, where required, the parts of their approach that may benefit with some adjustment and why.
- Highlight the use of percentage in evaluating the accuracy of the AI model. How can percentage be used to determine the success of the AI model? For example, ask students, ‘As a percentage, out of 10 attempts, how many times would you expect that the AI would be correct? Does it need to be 10 attempts for each classification? Is the data based on one person or multiple people? Why? How close or far from the camera does the hand gesture need to be? Is this a factor to test?’ Refer back to their initial question in case it needs refining.
- Look for groups that have found useful ways of recording their data and share with the class. For example, students may have thought to use screen captures of the outputs of the AI and use these to communicate the results of their investigation. Some groups may be using a hand-drawn table to record data, whereas others may be using a computer and spreadsheet. Discuss the benefits of using a spreadsheet to record, manipulate and visualise data. Discuss the most suitable graph for a dataset.
- Ensure each group considers, ‘What number of tests is reasonable to make generalisations to see any patterns or trends in the data?’
- Engage students in discussion about how to use their data to make inferences. What will they use to organise and visualise their data?
- Encourage and support groups to use a computer, tablet or laptop to analyse and visualise their data using a spreadsheet and charting software.
- Encourage students to include percentages in their claims about the accuracy the AI model. For example, the AI recognised the ‘rock’ on more than 90% of attempts; or on 20 attempts, the AI was at least 80% confident that the gesture was ‘rock’.
- Support prompt: How do you know if the AI is certain of the hand gesture?
- Enabling prompt: What level of accuracy would you expect out of 10 trials?
- Extending prompt: Which model is more accurate? How do you know?
Summary and reflection 5 mins
Ask students to reflect on their statistical investigation.
- What worked well? What might you do differently next time?
- What actions could you pursue as a result of the information presented from the investigation?
- What is something you learned as a result of your statistical investigation?