Mathematical modelling: Pizza problem
Year level: 7
Strand: Number/Measurement
Lesson length: 60 mins
In this lesson, students are provided with a real-world problem related to takeaway pizza. The problem centres around gathering evidence as they investigate the claim: ‘A company claims that their new size gives customers 50% more pizza’. Introduce the 4-step problem-solving model to guide students to use mathematical modelling.
The intention of this lesson is for students to use mathematical modelling to solve the problem. In order to encourage students’ investigative thinking, it is suggested that the problem be presented with limited scaffolding (at least in the initial stages). It is preferable that students choose an appropriate mathematical operation and use computational thinking to break the problem into parts to help solve it. In the process, they may use several strategies to model and solve the problem. The 4-step problem-solving model can be taught explicitly as a way of helping students to structure their approach.
Curriculum information
Achievement standard
Students use mathematical modelling to solve practical problems involving rational numbers, percentages and ratios, in financial and other applied contexts, justifying choices of representation.
Content descriptions
Students use mathematical modelling to solve practical problems, involving rational numbers and percentages, including financial contexts; formulate problems, choosing representations and efficient calculation strategies, using digital tools as appropriate; interpret and communicate solutions in terms of the situation, justifying choices made about the representation. AC9M7N09
Students use mathematical modelling to solve practical problems involving ratios; formulate problems, interpret and communicate solutions in terms of the situation, justifying choices made about the representation. AC9M7M06
Students describe the relationship between π and the features of circles including the circumference, radius and diameter. AC9M7M03
General capabilities
Numeracy
Assessment
Assess students' proficiency in calculating area and percentages.
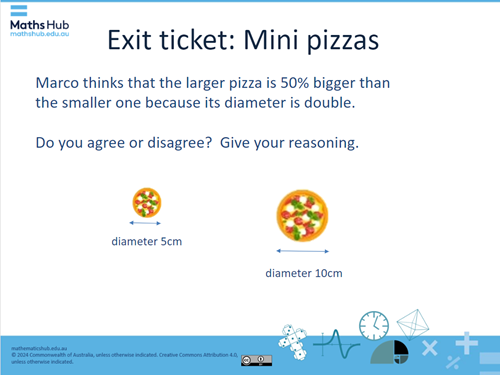
Slide: Exit ticket: Mini pizzas
Exit ticket: Mini pizza
In this task, students apply their knowledge of area and percentage to investigate a similar problem. Do they agree with Marco that the larger pizza is 50% larger than the smaller one?
In this task, students may suggest answers similar to:
- No, the 10 cm pizza is not 50% bigger than the 5 cm pizza.
- Just because the diameter is doubled, it doesn’t mean the pizza is only 50% larger.
- The 10 cm pizza is 300% bigger in area than the 5 cm pizza.
- When comparing the size of circles, you’re comparing their areas, which involves squaring the radius. So, doubling the radius leads to much more than a 50% increase in area.
Areas of challenge
Some students may:
- confuse radius and diameter. Be explicit about using correct vocabulary. Have a list of common terms displayed to assist students.
- not appreciate that π is a number.
- use the wrong measurement. Support students to identify the diameter and radius of each circle and which measurement is required to solve particular problems.
- confuse square numbers; students often multiply by two instead of multiplying the number by itself.
- have difficulty in leaving answers in terms of π, preferring rounded decimals. Note: suggesting students always use 3.14 to represent π may lead students to think that π = 3.14.
- see π as a variable and they substitute 3.14 for that variable.
- confuse the circumference and area formulas.
- not understand that percentages are multiplicative comparisons rather than differences.
Prerequisite student knowledge and language
It is expected that students:
- have an understanding of percentage and how to calculate the percentage of a given number
- be familiar with the relationship between radius, diameter, circumference and area of a circle
- have a basic understanding of subtracting values to find the difference between them.
It is also assumed students are familiar with terms such as:
- diameter
- Pi (π)
- radius
- percentage
- area.
What you need:
Lesson plan (Word)
Teacher’s slides (PowerPoint)
Exit ticket (PowerPoint)
Worksheet (Word)
Access to grid paper, paper sheets and scissors
Access to a computer with Excel, Numbers or Google Sheets (optional)
Learning goals
Learning intention
- We are using the context of a takeaway pizza to apply our knowledge of area and percentages.
- We are using a 4-step problem-solving model to guide our thinking and to investigate the company's claim.
Success criteria
By the end of this lesson, students can:
- calculate the area of circular shapes (pizzas) with different diameters
- compare the area of each pizza and express the difference as a percentage
- follow the 4-step problem-solving model to analyse and solve the problem using mathematical modelling.
Why are we learning about this?
In everyday life, we encounter claims made by companies that require us to use our mathematical knowledge to determine their accuracy. By developing these skills, we can critically evaluate information and make informed decisions based on evidence.
Learning hook 5 mins
Use the teacher’s slides to introduce this part of the lesson.
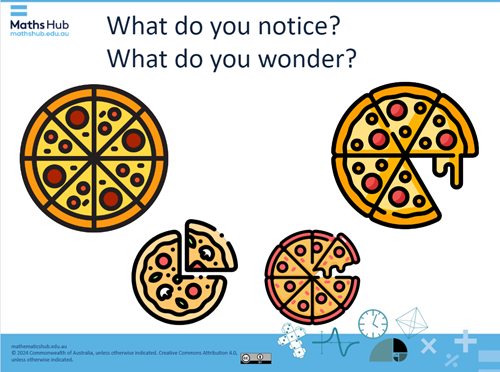
Refer to slide 2 to introduce the task. Ask students: ‘What do you notice? What do you wonder?’ about the pizzas shown on the slide.
Slide 2
- Generate discussion about the way the pizzas are divided and how the sizes compare.
- List what students notice or wonder, for example:
| Notice | Wonder |
|---|---|
|
|
Explore 45 mins
Introduction to the problem (5 mins)
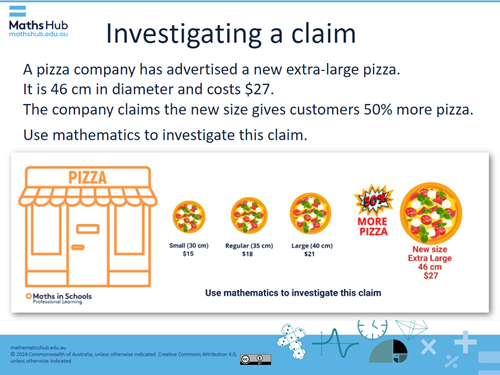
- Introduce this scenario: A pizza company has advertised a new ‘extra-large' pizza, which is 46 cm in diameter and costs $27. The company claims that this new size provides customers with 50% more pizza. (Slide 3)
- Ask how can we know if this claim is accurate? What do you think? Which pizza size is it being compared to? Assume that the claim is made compared to the large pizza 40 cm.
- Use a straw poll to gather students' initial thoughts on whether they believe the claim is ‘true’ or ‘not true’.
- Explain that we will use mathematics to investigate whether the company’s claim holds up.
Slide 3
Activity: Using a 4-step problem-solving process (40 mins)
Use slides 4 and 5 to introduce 4-step problem-solving process.
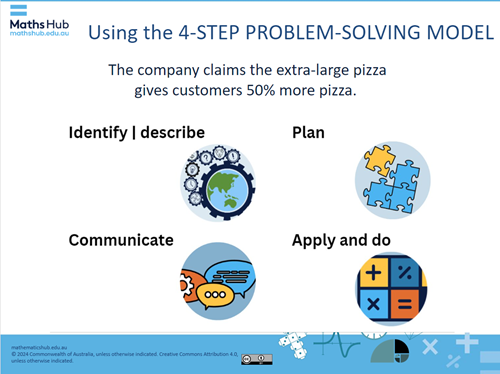
Slide 5
Use slides 6 to 9 to guide students to use the 4-step problem-solving model to solve this problem.
STEP 1: What numbers or information do you need to represent the problem mathematically? Think about the measurements, costs, or any other details that help you explore the company’s claim. (Slide 6)
STEP 2: What methods could you use to approach this problem? Consider how you’ll start and the steps you’ll take to analyse the size claim. Think about different strategies, such as using formulas, physical materials or digital tools that might help. (Slide 7)
STEP 3: This is where you can apply your maths knowledge. You may use the area formula for each pizza and compare the area and express it as a percentage. You may prefer to use physical materials, such as grid paper and pizza cut outs for each of the pizzas with different diameters. Then you would count the grid squares and compare them. If you’re familiar with Excel, Numbers or Google Sheets, use a spreadsheet to create formulas to automate the process. Another way would be to express one pizza as a ratio to another. (Slide 8)
STEP 4: Once you've reached a solution, explain it to the class. Why did you choose this method to represent the problem? How did your approach help you determine whether the company’s claim was accurate? Create a new ad with your own claim about the increase in size difference between two pizzas, for example, between the large and extra-large pizzas.
Students work individually or in pairs to follow the 4-step problem-solving model. You may choose to provide the worksheet to help guide the process and for students to record their thinking and approach.
Differentiation (support)
- How big is the extra-large pizza? How does knowing the diameter help to calculate the area of that pizza? How might you use grid paper and a paper cut out of that pizza to calculate the area? What would you do next?
- How might you use the formula for area of a circle: πr2? If you know the area of both pizzas, how can you compare them to find out how much bigger one is when compared to the other? How do you then express that as a percentage?
Differentiation (extension)
- Before working out the problem, estimate the percentage difference between the extra-large pizza and the other sized pizzas. How close were your predictions? Is the claim true?
- How might you use pizza slices as a comparison instead of the whole pizza?
- Which pizza is the best value? How do you know?
- If using Excel, create formulas that can work for any diameter, creating a reusable ‘pizza area calculator’.
Summary and reflection 10 mins
Summarise the lesson’s key points and invite students to reflect on what they’ve learned.
- How accurate was the company’s claim? What claim would you make about the extra-large pizza?
- What mathematical knowledge did you apply to investigate this claim? Select students with different approaches to share their solutions with the class. Use explicit teaching to highlight key concepts, including area, percentages and basic operations.
- What did you find interesting? What strategy helped you the most? How might you use these skills in other situations?