Year level: 5 / 6
Strand: Statistics
Lesson length: 60 mins
In this lesson, students acquire data related to key threats to the survival of osprey. Students work in small groups to rank a list of key threats and collate the data in a class spreadsheet. They sort the data to identify the overall class ranking of threats. Students create a pie chart of the threats commonly ranked as most important (ranked 1).
This lesson is the fifth in a series of six lessons that connect the cross-curriculum priority of Sustainability, Statistics and the Science learning area: Science as a human endeavour. AC9S5H01, AC9S6H01 and AC9S5H02, AC9S6H02.
This lesson was developed in collaboration with Conservation Without Borders. Data and information provided by Tweed Valley Osprey Project.

Learning goals
Learning intention
- We are learning about ways to represent and report on real scientific data.
- We will use the research tasks to develop our data skills including using a spreadsheet and creating charts.
Success criteria
By the end of this lesson, students can:
- rank a set of data
- sort data using a filter
- visually represent data as a pie chart.
Why are we learning about this?
The work done by research teams helps us to learn more about the natural world. Using the context of contributing to a research team gathering data, we can identify patterns, analyse trends, and observe changes over time. Exploring basic technologies, such as GPS tracking used by scientists, enhances our understanding of data collection and analysis. Additionally, mastering the creation and interpretation of data displays is a crucial skill, as it allows us to communicate information effectively through visual means.
Learning hook 5 mins
Download the teacher’s slides to accompany your teaching.
Use the quick quiz (slide 2) to introduce how conservation efforts are increasing the number of osprey.
- Explain that today we will be exploring how to rank and prioritise a list of threats to the osprey based on their importance, urgency or impact (slide 3).
- We will use a shared spreadsheet to collate group data to get an overall class ranking.
Explore 50 mins
Introduction (15mins)
Slide 5
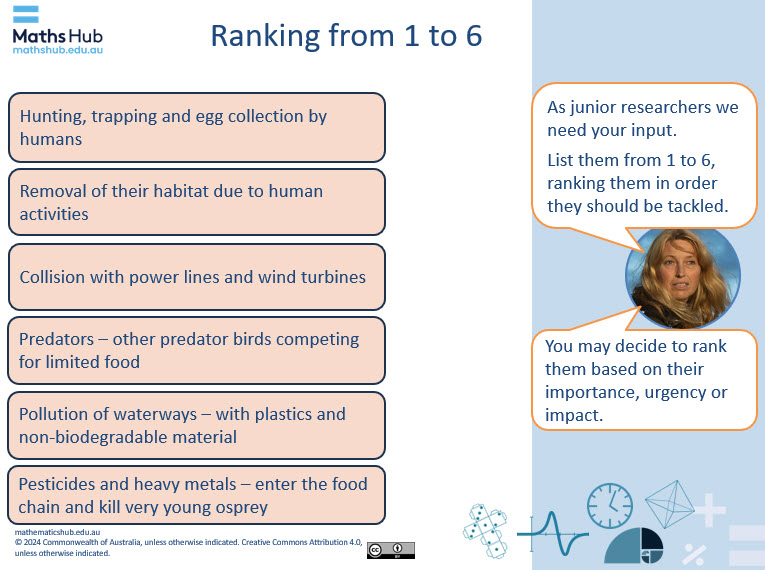
- List the six largest threats for the migrating osprey (slide 4).
- Explain that rankings provide a concise and effective way to communicate information. They can be easily understood and shared among different stakeholders.
- Organise students into small groups and provide each group with the Ranking threats to osprey sheet to discuss and record their group’s agreed ranking. The ranking of each threat can be based on its importance, urgency, or impact. To fully engage in ranking the threats students could have discussed these already in a science focused lesson.
Class collaborative activity (10 min)
- Introduce the task of collating group rankings into an overall class ranking (slides 6–8).
- Display the Class ranking spreadsheet (Excel). Provide each group with the spreadsheet so they can input their data.
- Assign each group a number that corresponds to a column on the spreadsheet, for example Group 1. Have a representative from each group to add their data to their group’s column in the shared spreadsheet.
- Demonstrate how to sort and filter the data selecting the total (column L) smallest to largest. Explain how this now ranks the questions in order of importance as suggested by the class.
- Explain that by creating a class table of information, students can use this data to see the collective opinions of the class and gain insights into the overall ranking of threats to osprey.
Practical task (25 min)
- Explain that students will use the compiled class data to identify the threats commonly ranked most important by totalling the threats ranked 1 in a new table.
- Students visually represent these threats using a chart. They use a laptop or tablet to access and save the data in a table on their own device and create a column graph or a pie chart to visualise the information.
- Students can refer to the tab ‘Threats ranked 1’ which provides a table and a sample pie chart to use.
- Once the graph is created, discuss the results with the class. Ask students to explain their group rankings and discuss any patterns or trends that emerge from the class collated data.
Differentiation (enable)
- How can you rank data? How does sorting data help with data interpretation?
Differentiation (extend)
- How does a pie chart use percentage? Is there any benefit in using a pie chart over a column graph? Explain your answer.
Summary and reflection 5 mins
- Encourage students to reflect on the process and discuss how their individual rankings compare to the class collated data. This can help them understand different perspectives and the importance of collaborative decision-making.
- Discuss the statement, ‘Ranking helps focus resources on the most important things first, making resource allocation more efficient.’